Route of spread of cardiac excitation:
Depolarisation intiated in SA node–> spreads radially through atrium–> AV node –> nodal delay–> Depolarization of the ventricular muscle starts at the left side of the interventricular septum and moves first to the right across the mid portion of the septum. The wave of depolarization then spreads down the septum to the apex of the heart. It returns along the ventricular walls to the AV groove, proceeding from the endocardial to the epicardial surface. The last part to depolarise is the posterobasal LV, pulmonary conus and top part of septum.
SA node is located at the junction of SVC with the right atrium. The AV node is located in the right posterior portion of the interatrial septum. There are three bundles of atrial fibers that contain Purkinje-type fibers and connect the SA node to the AV node: the anterior internodal tract of Bachman, the middle internodal tract of Wenckebach, and the posterior internodal tract of Thorel.
The AV node is continuous with the bundle of His, which gives off a left bundle branch at the top of the interventricular septum and continues as the right bundle branch. The left bundle branch divides into an anterior fascicle and a posterior fascicle. The branches and fascicles run subendocardially down either side of the septum and come into contact with the Purkinje system, whose fibers spread to all parts of the ventricular myocardium.
The conduction system is composed, for the most part, of modified cardiac muscle that has fewer striations and indistinct
boundaries. A fibrous tissue ring seperates the Atria and ventricles, and normally the only conducting tissue between the atria and ventricles is the bundle of His. On each side, most sympathetic fibers come from the stellate ganglion. Noradrenergic fibers are epicardial, whereas the vagal fibers are endocardial. Myocardial fibers have a resting membrane potential of approximately –90 mV
Read ECG once (you know this anyway).
The body is a good conductor(volume conductor) so fluctuations in potential that represent the sum of the action potentials of myocardial fibres can be recorded externally.
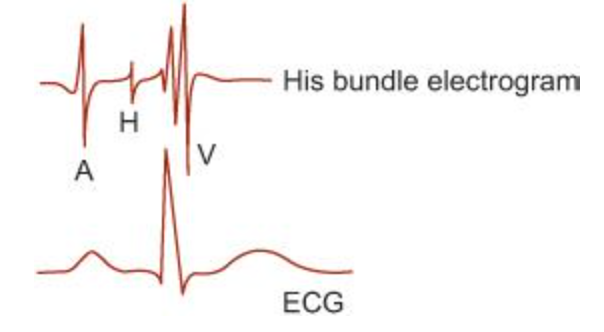
Read His bundle electrogram once, i.e. just know the principle of it.
Ganong’s Review of Medical Physiology, 24th Edition
A catheter with an electrode tip is inserted and positioned near the tricuspid valve and it records electrical activity. Regular leads are also recorded simultaneously.
| A | When AV node activated | PA 27ms |
| H | Transmission though His Bundle | AH 92ms |
| V | Transmission through ventricles | HV 43ms |
Arrhythmias
- Heart block
- 1st – prolonged PR, abnormally slow conduction through atria
- 2nd – type 1/Wenkebach – PR prolongs with each QRS then a QRS is dropped.
- 2nd – Mobitz type II – QRS drops intermittently, sometimes in a fixed ratio – is pathological and can progress to complete HB – needs PPM
- 3rd – complete block so no relationship between QRS and P waves. Ventricular rhythm is at 35bpm, nodal rate is at 45bpm(AV block)
Stokes Adams attacks are when bradycardia is associated with dizziness/syncope.
- Bundle Branch Block
- causes widened QRS but rate is NORMAL (to differentiate from complete HB)
- Hemiblocks
- Left anterior hemiblock produces abnormal left axis deviation in the ECG, whereas left posterior hemiblock produces abnormal right axis deviation.
- Ectopic beats – cause a pause after them
- Escape rhythms – have a pause before them
- Paroxysmal tachycardia
- ectopic focus – increased automacity
- re-entry circuit – where a wave of excitation propagates continuously within a closed circuit. Usually happens when there is an extra bundle of connecting tissue between atria and ventricles or if there is a transient block in conduction of tissues. Eg Wolf Parkinson White where the bundle kent is an additional conduction link between Atria and ventricle in addition to AV node.
- Atrial flutter – 230-300 atrial rate with ventricular rate around 220 due to AV block
- AF
- SVT have H deflection on HEG but ventricular tachycardia don’t
- Digoxin increases AV block so can be used for rate control in AF.
- Torsades de pointes – different looking QRS complexes
- VT more pathological than SVT due to higher rate of CCF and VF
- Ventricular fibrillation – ventricle totally inco-ordinate
Long QT – drugs and congenital causes. Important because pts are more vulnerable to ventricular arrhythmias and sudden death.
Acute myocardial infarct and its effects:
| Defect in Infarcted Cells | Current Flow | Resultant ECG changes in leads over infarct |
|---|---|---|
| Rapid Repolarisation | Out Of infarct | ST Segment Elevation |
| Decrease Resting Membrane Potential | Into Infarct | TQ Seqment depression (Menifested as ST Segment elevation) |
| Delayed Depolarisation | Out of Infarct | ST segment elevtion |
Ganong's Review of Medical Physiology, 24th Edition
- Infarcted cells during discharge –> K channels get opened early –> rapid repolarisation–> so infarcted tissue is relatively positive compared to normal tissue –> current flows from infarct to normal tissue –> ST elevation
- The K opening also –> resting membrane potential drops –> at diastole the current flows into the infarct–> TQ segment depression manifests as ST elevation
- The K channel opening and lower resting potential –> delayed depolarisation–> makes infarcted tissue relatively positive –> current flows from infarct to normal tissue –> ST elevation
- Later changes
- q waves
- Heart block
- Bundle branch block
- Lack of normal QRS progression
- TWI
- Effects of ionic changes in the blood
- K
- High
- At 7 – tall peaked T waves
- At 8.5 – loss of p wave, widening QRS and T wave still tall. Further elevation in K may result in VT or VF
- Low
- At 3.5 – ST depression, U wave after T wave, normal QT
- At 2.5 – ST depression, prolonged PR, T wave inversion, U wave, normal QT
- High
- Ca
- Low
- Prolongation of ST and therefore QT
- Also same effect caused by TCA and phenothiazines
- Low
- K
The cardiac cycle
Phases
- Passive ventricular filling 70%
- Atrial systole to finish the filling
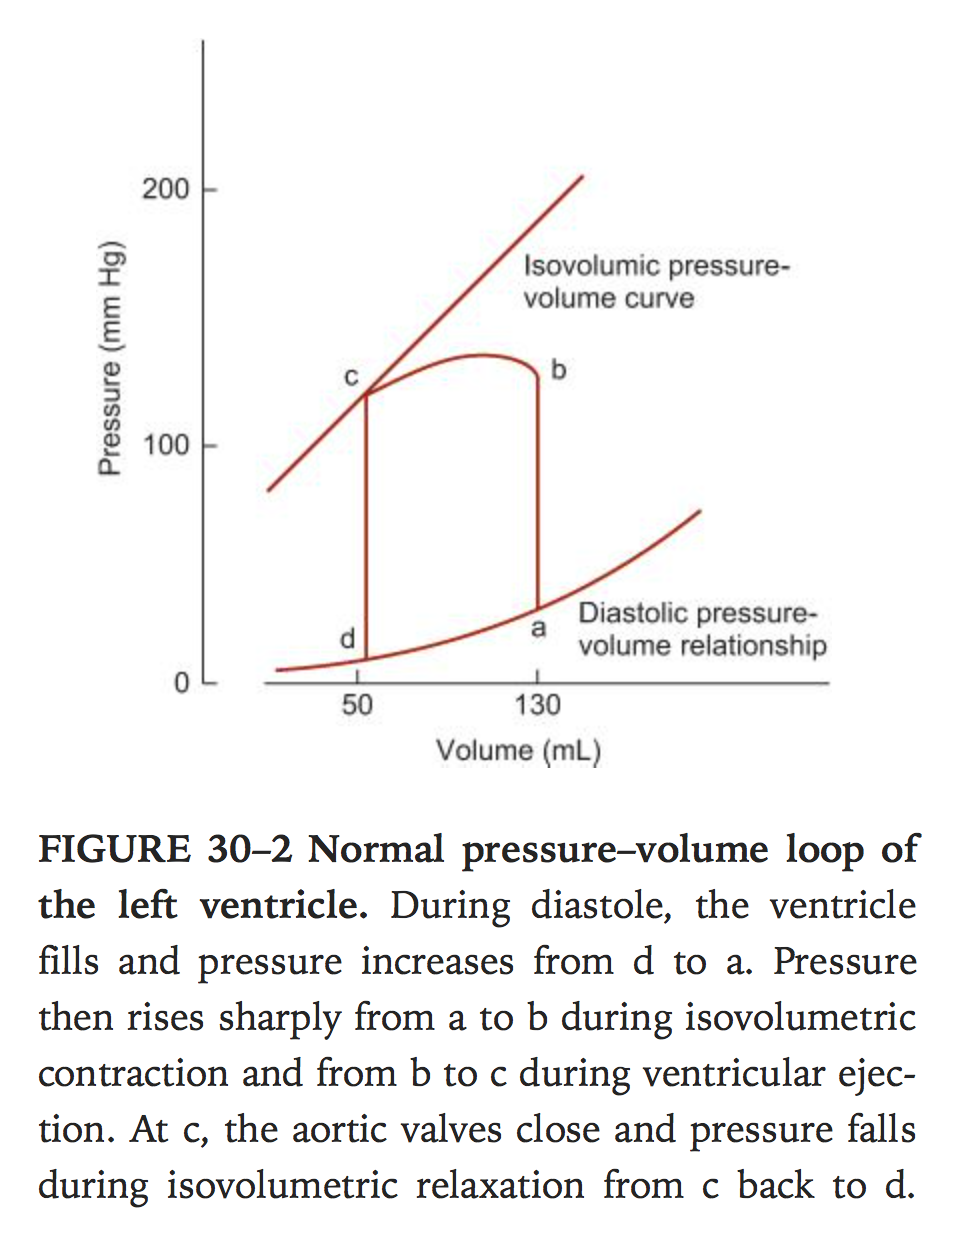
- Isovolumetric contraction of ventricle
- When intra-ventricular pressure exceeds pressure in aorta(80mmHg) and pulmonary artery(10mmHg) the valves open and ventricular ejection starts. Peak pressures are 120 and 25 in left and right ventricles respectively during systole. When aorta and pulmonary artery pressure exceeds ventricular pressure the valves close(there is a brief period where the blood keeps flowing due to momentum)
- Isovolumetric relaxation
- Ventricle pressure drop below that of atria and AV valves open and diastole begins
End diastolic volume approx 130ml, end systolic volume approx 50ml, EF approx 65% – can be measured by injecting radionucleotide labelled red cells and measuring amount at end of diastole and systole.
Ganong’s Review of Medical Physiology, 24th Edition
JVP waves
- A wave – atrial systole, vein back flow
- C wave – tricuspid valve bulge back into atrium during isovolumetric contraction
- V wave – rise in atrial pressure just before tricuspid valve opens.
Heart sounds
- S1 – closure of AV valves
- S2 – closure of aortic and pulmonary valves
- S3 – heard 1/3 of way through diastole – thought to be due to rapid ventricular filling
- S4 – heard just prior to S1, when atrial pressure is high or ventricles are stiff, rarely heard in normal adults
- Expiration – aortic and pulmon close together. During inspiration there is lower pressure in pulm vasc so pulm valve closes later.
Cardiac output
- How to measure it
- Echocardiogram with doppler
- Fick’s method
- Principle – amount of substance taken up by an organ equals amount in arterial blood minus amount in venous blood times the blood flow, when the artery is the sole source of the substance. Eg O2 – any artery minus venous sample from pulmonary artery.
- Indicator dilution method
- Known amount of substance eg radio-isotope dye is injected in a vein and serial measures are taken from an artery. Cardiac output is measured but measuring amount injected divided by concentration in arterial blood after a single circulation through heart. In practice this is plotted on a log scale. Eg thermodilution.
- Average value.
- Stroke volume 70-90ml
- Cardiac output 5L/min
- Cardiac index = CO per body surface area(m2) normally around 3.2L/min/m2
What factors control cardiac output ?
- Stroke volume x Heart rate
- Increase – anxiety, exercise, pregnancy, eating, high external temps, adrenaline
- Decrease – heart disease, fast arrhythmias, sitting/standing from lying position
What is preload / afterload / contractility ?
- All three affect stroke volume
- Preload – end diastolic volume which gives the length tension relationship to ventricular wall
- Afterload – amount of resistance faced by systole
- Contractility – intrinsic constrictive capacity of heart muscle.
Length-Tension relationship in cardiac muscle. (i.e. Frank-Starling law – EDV vs stroke volume).
As the length is stretched the tension increases to a point then decreases
Factors affecting EDV (preload).
- Length of diastole/heart rate
- Muscle pumps eg calves contracting
- inspiration
- Dehydration
- Ventricular stiffness – inflitrative disease, fibrosis, MI
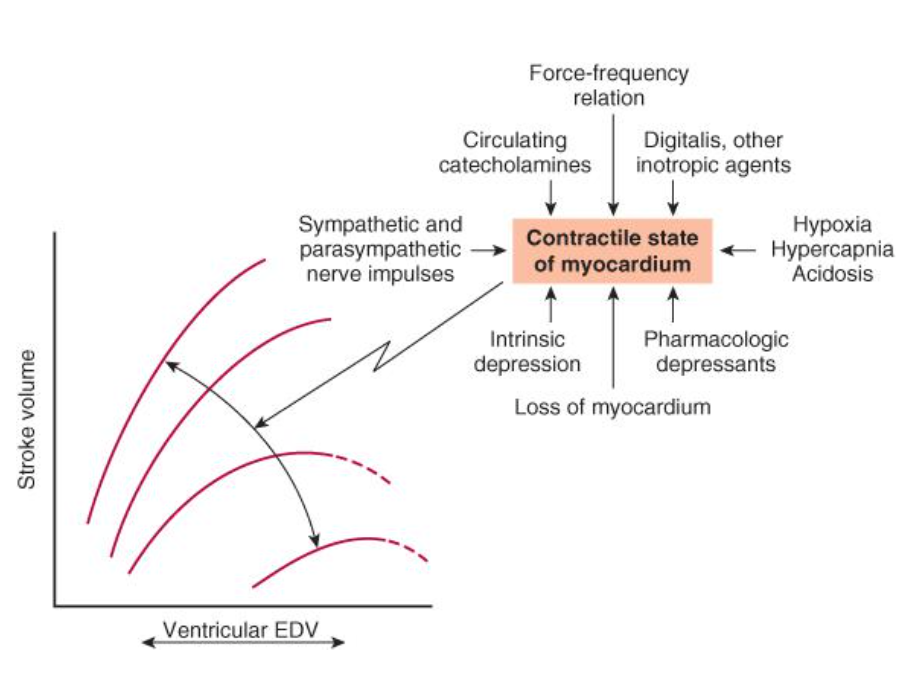
Factors affecting contractility
Ganong’s Review of Medical Physiology, 24th Edition
The curve shifts downward and to the right as contractility is decreased. The major factors influencing contractility are summarized on the right. The dashed lines indicate portions of the ventricular function curves where maximum contractility has been exceeded; that is, they identify points on the “descending limb” of the Frank–Starling curve. EDV, end-diastolic volume.
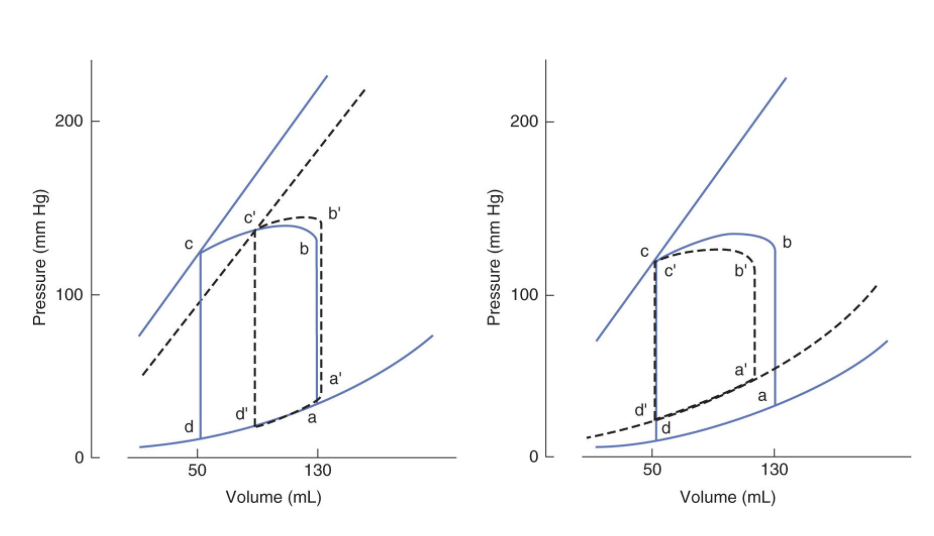
Effects of Systolic and Diastolic Dysfunction on the pressure volume loop of the Left Ventricle
Ganong’s Review of Medical Physiology, 24th Edition
In both panels, the solid lines represents the normal pressure–volume loop (equivalent to that shown in Figure 30–2 and the dashed lines show how the loop is shifted by the disease process represented. Left: Systolic dysfunction shifts the isovolumic pressure–volume curve to the right, decreasing the stroke volume from b–c to b’–c’. Right: Diastolic dysfunction increases end-diastolic volume and shifts the diastolic pressure–volume relationship upward and to the left. This reduces the stroke volume from b–c to b’–c’.
Vivas
Pacemaker potentials -how are they generated ? See week 2